
3 Considerations Before Setting a Salary – and How Our New Wage Benchmarking Tool Can Help
The past 12 months have been a whirlwind for both job seekers and employers. From the record-high job openings in July 2022 to the recent wave of tech layoffs, the only thing that’s been consistent about our job market is its inconsistency.
Regardless of turbulence, though, setting salary bands is a necessary part of any employment process. And for employers, this work isn’t easy – especially as salary transparency legislation picks up steam nationwide.
Here, we’ll highlight three considerations employers make when setting a salary and how our Wage Benchmarking Tool, now included in our Job Market Pulse product, makes this work easier.
1. Is the Job Remote or Onsite?
Though many job seekers now view hybrid and remote work as more of an expectation than a perk, they’re still willing to make sacrifices to get it. Case in point: 45 percent of workers would take a pay cut to work remotely on a permanent basis.
This is to say, if you’re an employer that offers remote work, there might be more flexibility on the lower end of your salary band. Alternatively, you could flex your salaries to fit different cities and their costs of living.
For instance, someone living in New York City deals with 239 percent higher rent prices than someone living in Tuscaloosa, Alabama. In other words, if you’re hiring for a role in New York City, you probably shouldn’t pay Tuscaloosa rates, and vice versa.
Calculating salaries to remain competitive and keep up with the cost of living in various areas isn’t easy, though. It requires a fair bit of research. And if you’re trying to attract talent in your area, it can be difficult to aggregate and view the wages that other employers offer.
Job Market Pulse – specifically, our Wage Benchmarking Tool – makes this work simple.
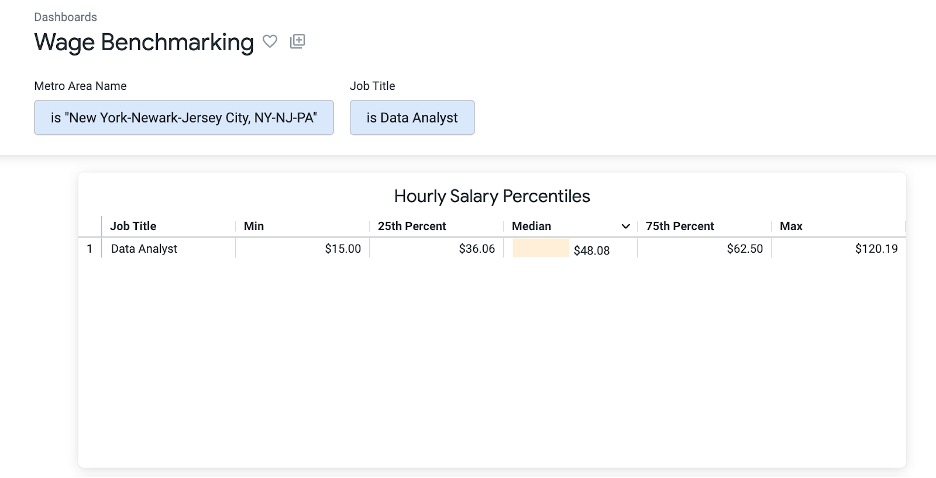
Let’s say you run a call center in the New York City metropolitan area that’s hiring data analysts. With the Wage Benchmarking Tool, you can see the salary ranges of all the relevant listings in our database (Figure 1).
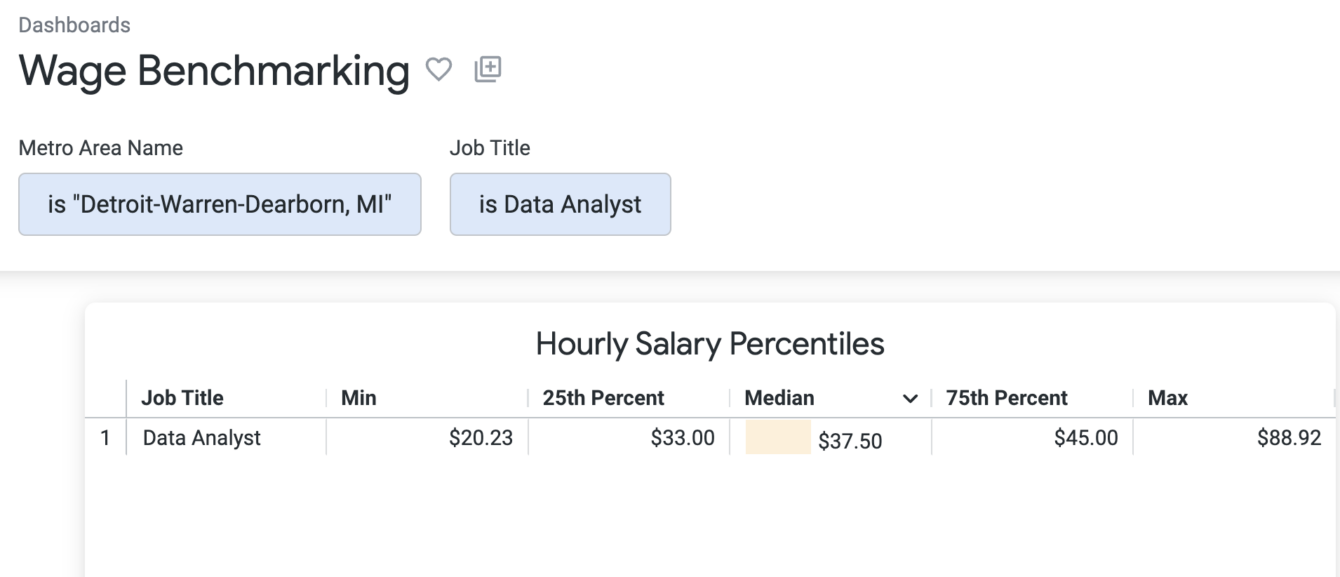
If you’re hiring for remote positions, you can expand the search to different regions and see how the salary ranges change (Figure 2).
In short, this tool lets you confirm the going rate for real-time open positions in your area or your competition’s area, and helps ensure the salary bands you create are fair – both for job candidates and your company. It can also display the wages as yearly earnings – if that’s how you prefer to view the data.
So, in this case, our Wage Benchmarking Tool would share that the median salary for Data Analysts in the NYC metro area is $100,000 and drops to $78,000 in the Detroit metro area. Can you hire remotely in Detroit? Maybe, but even if not, this can be very powerful and useful business intelligence to have.
2. What Is the Full Compensation Package?
During the Great Resignation, employers were offering lucrative sign-on bonuses and accelerated promotion schedules to lock down talent. While that aggressive recruiting approach has slowed in recent months, it doesn’t discount the importance of the full benefits package when setting a salary band.
Fully paying health insurance premiums and offering a 401k match is great, but those benefits aren’t reflected in the salary an employee accepts. And if you’re an employer, that makes researching total compensation packages for similar roles in your area a pain.
This pain largely arises from ineffective salary parsers. A quick bit of context: salary parsers automatically detect any text in a job description related to compensation. They then export the data to a relevant field in a job board listing.
Traditional salary parsers work great when the only wage information in a job description is a salary or hourly rate. But what happens when an employer includes that “$1,000 sign-on bonus” in the description? The salary parser might process this $1,000 bonus as the sole compensation for the role. Not great.
Fortunately the salary parsing with our Wage Benchmarking Tool is different. With it, we can identify the differences between bonuses and salaries – and we can even create custom reports that share every relevant listing that includes keywords like “bonus.”
Plus, it can work across different languages, currencies, and formats (hourly, daily, weekly, annually, etc.). This comes in handy when looking at salaries for, say, truck driver job openings that list wages as a rate per mile driven (e.g., $1.75 per mile for owner/operators or $.45 per mile for corporate drivers).
This is all to say: with our tool, you can more accurately gauge the full compensation packages other employers in your area offer to make sure your job postings display competitive wages.
And we’re working on expanding the Wage Benchmarking Tool further. In the coming months, you can expect to see additional data mentioned in job postings, from retirement plans to insurance benefits to PTO plans. In fact, we can already track some of these additional custom fields by request. So if this is of interest to you, let us know!
3. What Are Your Competitors Offering for Similar Job Listings?
If you’re hiring in a competitive market, you want every advantage you can get. Today, that advantage comes from data. Lots of data.
Salary benchmarking tools aren’t new. There are plenty of them. But most of these tools give you estimates and ranges of salaries without giving you direct access to the original data. That means it’s tough for you to accurately track monthly or quarterly trends, let alone real time – and you’re rarely given the ability to hone in on certain competitors in your industry.
This competitive intelligence is often crucial for hiring. Let’s say you operate various senior living communities near Los Angeles. Lately, promising candidates have started abandoning your interview processes to join an even larger competitor of yours.
You know the median hourly wage for a registered nurse is $17.50 in your area (Figure 3). You also know that, given the caregiver shortage, you likely need to offer more. But how can you retain your employees and attract top-end talent without undercutting yourself?
Check what your competitor offers.

You can do that by viewing the preset Jobs Sample list (Figure 4), or by asking us to create a custom report that displays the competitors in your area. And, because we’re updating and adding listings every day, you know the data is both current and accurate.

Job Market Pulse’s Wage Benchmarking Tool Isn’t Just for Employers
We spent this blog discussing the ways employers can use Job market Pulse’s Wage Benchmarking Tool to get an edge in recruiting. But this tool isn’t just for employers. As salary transparency mandates grow in popularity, researchers, compliance bodies, and journalists will need data to verify the success of these mandates.
Want to learn more about Job Market Pulse or how our Wage Benchmarking Tool can help you in your talent search? Shoot us a message!