

Regional Momentum and Macro Reality
A Year That Looks Simpler Than It Was
At the highest level, 2025 looks like a modest cooling year.
Total U.S. job vacancies declined 3% YoY, falling from 7.73 million in December 2024 to 7.5 million in December 2025. The decline was gradual rather than abrupt. Monthly vacancy totals trended lower across the year, with softness becoming more visible in the fourth quarter.
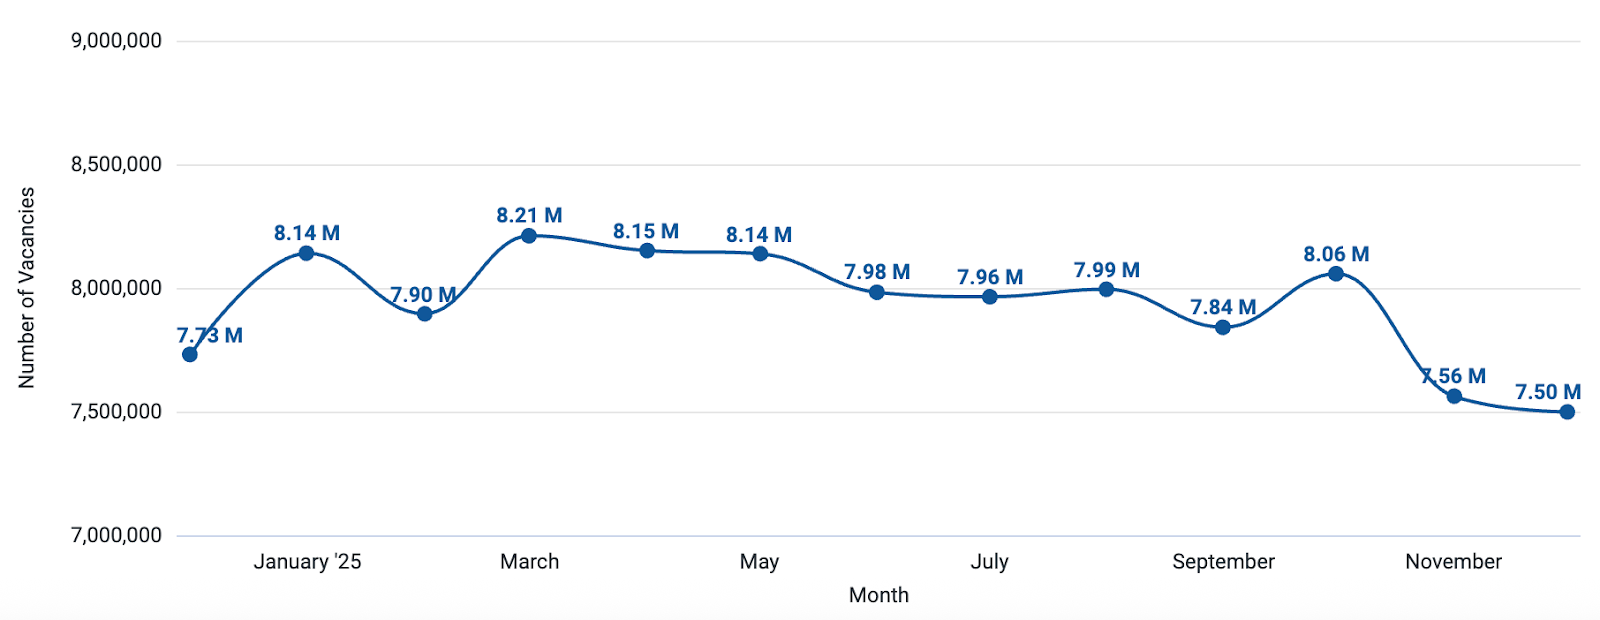 Figure 1: U.S. Vacancy Trend – Monthly vacancy totals, December 2024 – December 2025
Across job categories, the pattern reinforced that moderation. Of 35 tracked categories, 25 recorded YoY declines while only 10 posted gains. The slowdown was broad, not isolated.
That is the macro view.
But macro totals can flatten the story. To understand how 2025 actually felt inside organizations and across regions, we have to zoom in.
White-Collar Hiring Was Stable, but More Concentrated
While total vacancies declined 3% nationally, white-collar job postings were broadly flat year over year, down approximately 0.6%, ending in December at 699,160. On the surface, that suggests stability.
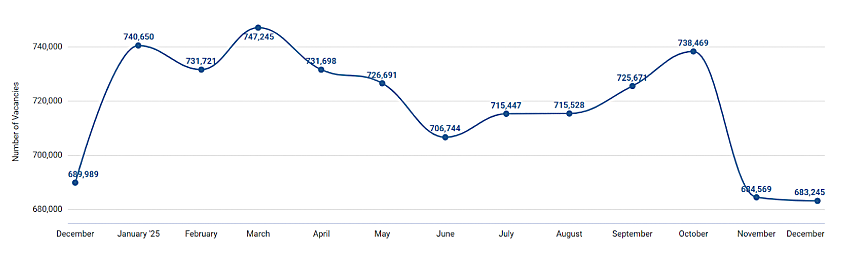
Figure 2: White-Collar Job Postings Trend
The path to that year-end number tells a different story. Activity rose sharply at the start of the year, peaking in the first quarter, before falling through the spring to a mid-year low in June. Postings then recovered through the summer and into October. The decline in November and December aligns with typical year-end seasonality, when budgets close and hiring activity slows. The key question is whether that softness carries into early 2026, which we will track closely.
Rather than a steady trend, the pattern is cyclical. Periods of recovery were followed by renewed pullbacks, and none of the later increases sustained the early-year levels. The market did not move in a straight line, but it also did not build lasting momentum.
This is what tightening looks like in practice. Hiring intent did not disappear, but it became more selective, concentrating on a smaller set of strategic roles.
Hiring Growth and Decline by Role
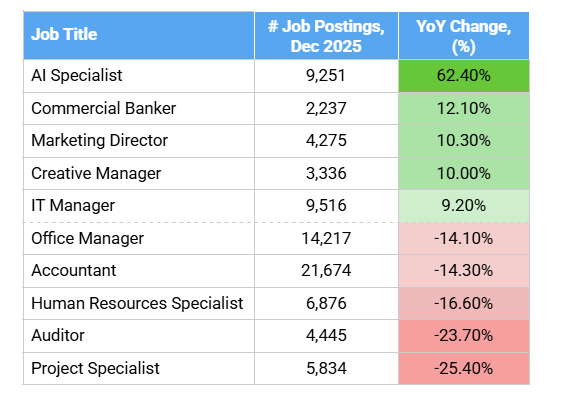
Figure 3: Hiring Growth and Decline by Role
AI Specialist postings increased 62.4% YoY. Commercial Bankers, Marketing Directors, Creative Managers, and IT Managers all recorded solid growth. These roles are directly connected to revenue, capital allocation, digital capability, and strategic execution.
At the same time, the number of Project Specialists and Auditors declined by more than 20%. Human Resources Specialists, Accountants, and Office Managers also posted double-digit decreases.
This is not a uniform contraction. It is prioritization. Companies appear to have concentrated hiring intent in high-impact functions while trimming administrative infrastructure.
White-collar hiring became more selective before that shift was fully visible in the broader labor market.
From National Cooling to Regional Divergence
National vacancy totals show moderation. White-collar data shows sharper tightening. The state map reveals where that tightening landed.
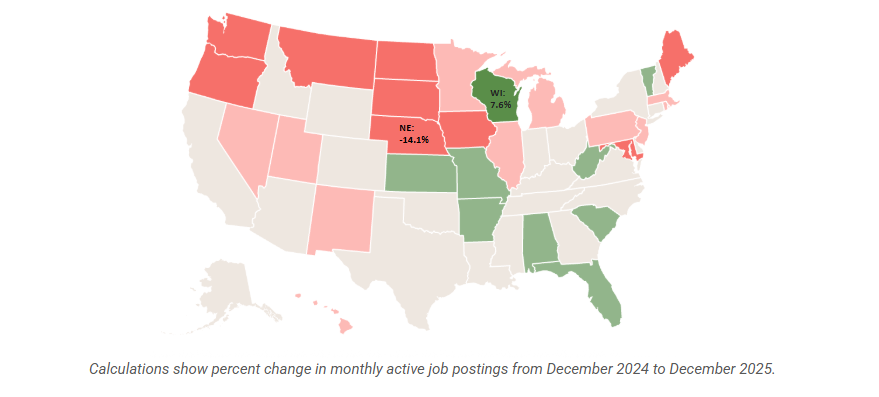 Figure 4: YoY Vacancy Percent Change by State Map
Thirty-six states recorded year-over-year declines in job postings in 2025. Only fifteen posted growth, and most gains were modest.
Wisconsin rose 7.6%. Alabama and Kansas each increased 4.7%. South Carolina grew 4.3%.
In contrast, Nebraska declined 14.1%. The District of Columbia fell 14.0%. Maine, Oregon, and Washington each posted declines exceeding 11%.
The District of Columbia deserves specific attention. Its labor market is uniquely tied to federal employment and agency activity. The sharp decline in postings likely reflects federal job cuts and constrained government hiring, which disproportionately affect D.C. compared to other regions. That dynamic makes its contraction structurally different from a typical private-sector slowdown.
The spread between the strongest and weakest states exceeds twenty percentage points. That is not marginal variation. It reflects a fragmented labor market.
Labor Market Outcomes Are Beginning to Reflect the Shift
Job postings measure hiring intent. Unemployment reflects realized labor market conditions. In 2025, the two began moving more closely together in several states.
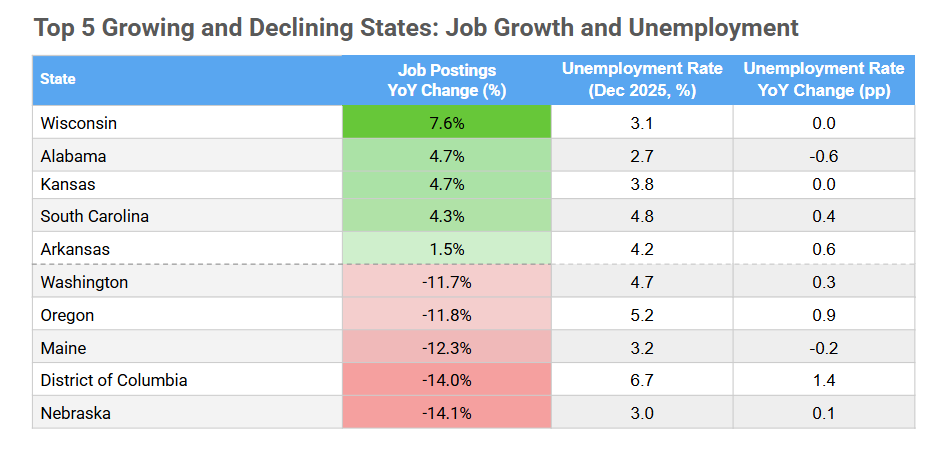 Figure 5: Top 5 Growing and Declining States: Job Growth and Unemployment Table
Wisconsin’s unemployment rate held steady at 3.1%. Alabama’s declined by 0.6 percentage points. Kansas remained stable.
Meanwhile, the District of Columbia saw unemployment rise by 1.4 percentage points. Oregon increased by 0.9 percentage points. Washington rose by 0.3 percentage points.
The alignment is not perfect, but it is directionally consistent. In several states where posting activity fell sharply, labor market softness has begun to appear in unemployment figures.
The Quiet Middle
Not every state experienced meaningful acceleration or contraction.
Job Posting Trends in States with the Smallest YoY Change
Vermont (0.0% YoY)

Florida (-0.1% YoY)

New Hampshire (-0.2% YoY)

Figure 6: Job Posting Trends in States with the Smallest YoY Change
New Hampshire declined just 0.2% YoY. Florida declined by 0.1%. Vermont was effectively flat at 0.0%.
These states fluctuated month to month but ended close to where they began. They neither expanded meaningfully nor contracted materially. Their stability reinforces the idea that 2025 was not defined by a single national experience.
Corporate Hubs Are Adjusting Too
Even the largest corporate markets were not insulated.
Top 10 States by Corporate Job Postings
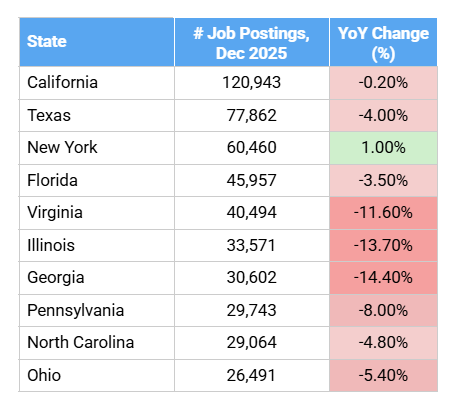
Figure 7: Top 10 States by Corporate Job Postings
California led with 120,943 corporate postings in December. Texas followed with 77,862. New York recorded 60,460.
Yet YoY changes show that Texas declined 4.0%. Florida fell 3.5%. Virginia dropped 11.6%. Illinois declined 13.7%. Georgia fell 14.4%. New York was one of the few large states to post modest growth at 1.0%.
The core business centers remain dominant in total volume. They are simply operating at a lower intensity.
Completing the Picture
At the macro level, total U.S. vacancies declined 3%. Twenty-five of thirty-five job categories softened. Thirty-six states recorded declines. A small number of strategic roles expanded sharply even as administrative functions contracted.
The headline suggests moderation. The details reveal redistribution.
2025 was not a year of collapse. It was a year of tightening priorities, uneven geography, and selective investment. The macro data sets the tone. The white-collar and regional data explain where the pressure was felt most clearly.
That is what the national number alone cannot show.
Data Methodology
The findings in this analysis are based on Aspen Tech Labs’ JobMarketPulse platform, which monitors hiring activity from more than 350,000 direct employer career sites worldwide. This dataset captures a substantial share of live postings and provides near-real-time insight into employer demand. All figures reflect information published directly by employers, including salary ranges where available. All data comes from posted job requirements; salary figures should be interpreted as indicators of market trends rather than confirmed offer amounts. Changes reflect real shifts in hiring activity rather than database expansion or methodological updates.