
What the Early 2026 Labor Market Signals Actually Show, and What They Don’t
Every January, the labor market looks like it might be turning a corner. Most years, it is simply resetting.
December is predictable. Budgets close. Open roles are reviewed. Some postings are removed from employer career sites while teams reassess priorities for the year ahead. Then January arrives, approvals restart, requisitions are refreshed, and posting volumes rise. It feels like momentum, even when it is mostly timing.
In January 2026, U.S. job postings increased 4.0% compared to December. That sounds encouraging. Yet compared to January 2025 labor market trends, total vacancies were still 4.3% lower. The rebound is real. So is the year-over-year decline.
That tension captures the mood of the early 2026 labor market. The market is not collapsing, but it is continuing a gradual decline that began in 2024. Employer hiring intent remains below prior year levels for the second consecutive year. January’s rebound reflects seasonality, not recovery.
Before going further, it helps to clarify what this data represents. Aspen Tech Labs analyzes job postings collected directly from more than 350,000 employer career websites. These figures reflect employer hiring intent, not confirmed hires. A posting signals that a company plans to recruit for a role. It does not tell us whether the role was ultimately filled, how many candidates were hired, or whether the position was later paused. That distinction is especially important in a year when small shifts can be easily overstated.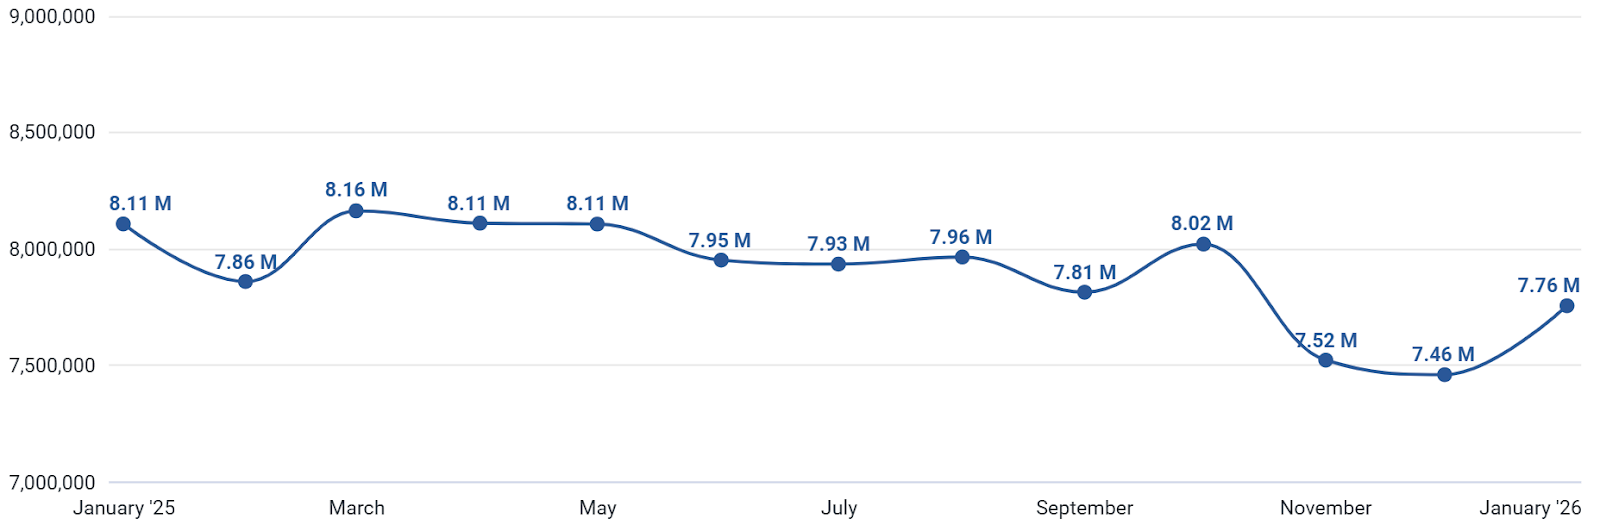
Figure 1: Monthly total number of U.S. vacancies over the last 12 months
Remote roles tell a similar story. They rose 6.1% compared to December but remain 5.2% below January 2025 levels. The trajectory in the remote chart mirrors the broader market. Remote job postings have not disappeared, but they have not regained expansion momentum either. The line stabilizes rather than climbs.
If the labor market were gaining strength, we would expect to see January pushing clearly above prior year levels. The chart does not show that. It shows normalization.
Operating at a Lower Altitude
The YoY comparison matters more than the MoM bounce. January 2026 remains 4.3% below January 2025 in total vacancies. That marks the second consecutive year of softer annual levels, reinforcing that the broader direction is still downward, even if the pace is measured.
The state-level MoM change chart adds useful context. Vacancy levels traditionally pick up at the start of the year, and this January follows that pattern. Most states recorded increases from December, with only a small number showing MoM declines (Figure 2). The gains are broad rather than concentrated in a few breakout regions. That distribution suggests seasonal reactivation rather than the beginning of a new expansion cycle. When nearly the entire country moves modestly higher at the same time, it usually reflects budget resets and posting refreshes, not a surge in demand.
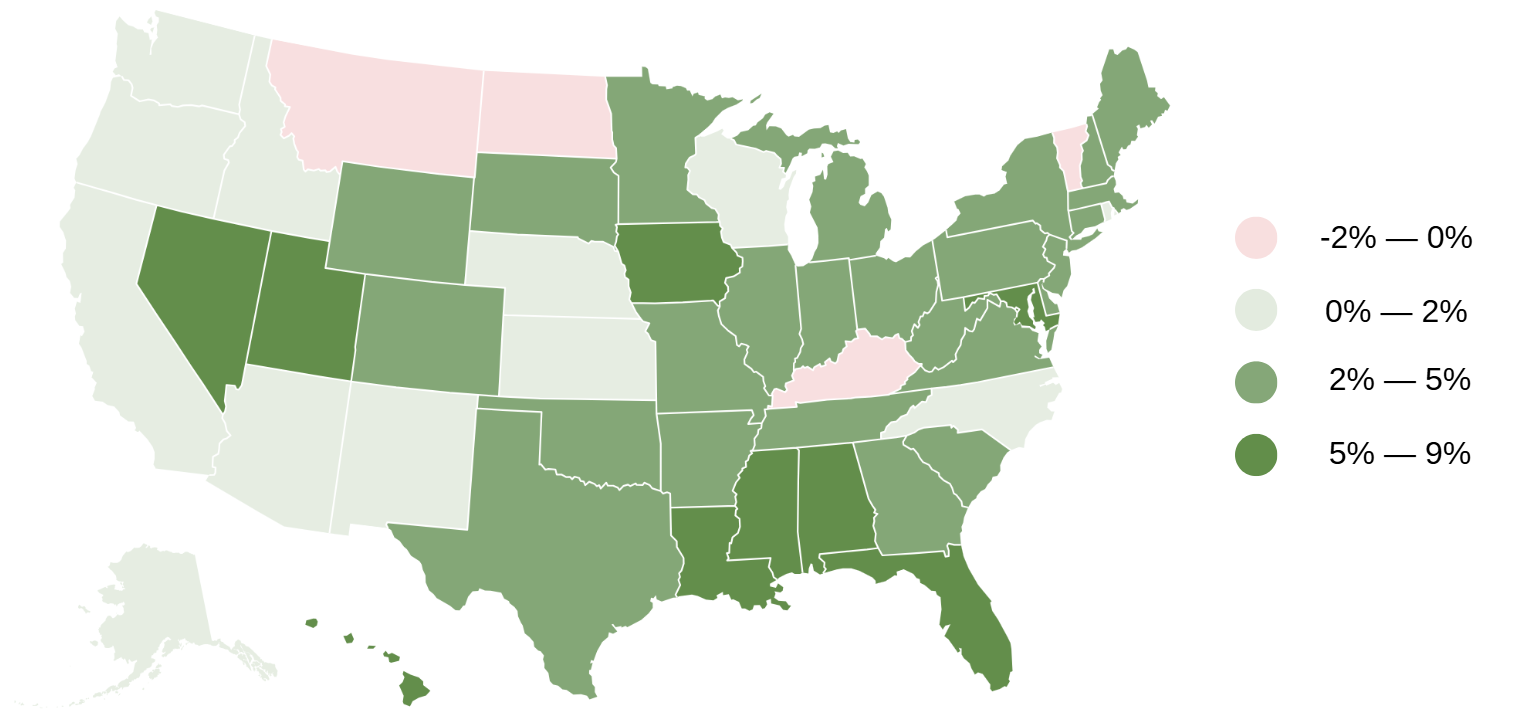
Figure 2: MoM change in job vacancies by state, from December to January.
Healthcare and nursing roles account for 26% of all vacancies in January (Figure 3). That concentration is important. It shows that structural demand in essential services continues to anchor overall posting volumes. Restaurants, retail, and business services remain significant contributors as well. The composition of postings suggests that core operational roles are carrying the market, while discretionary or expansion-driven hiring intent remains more restrained.
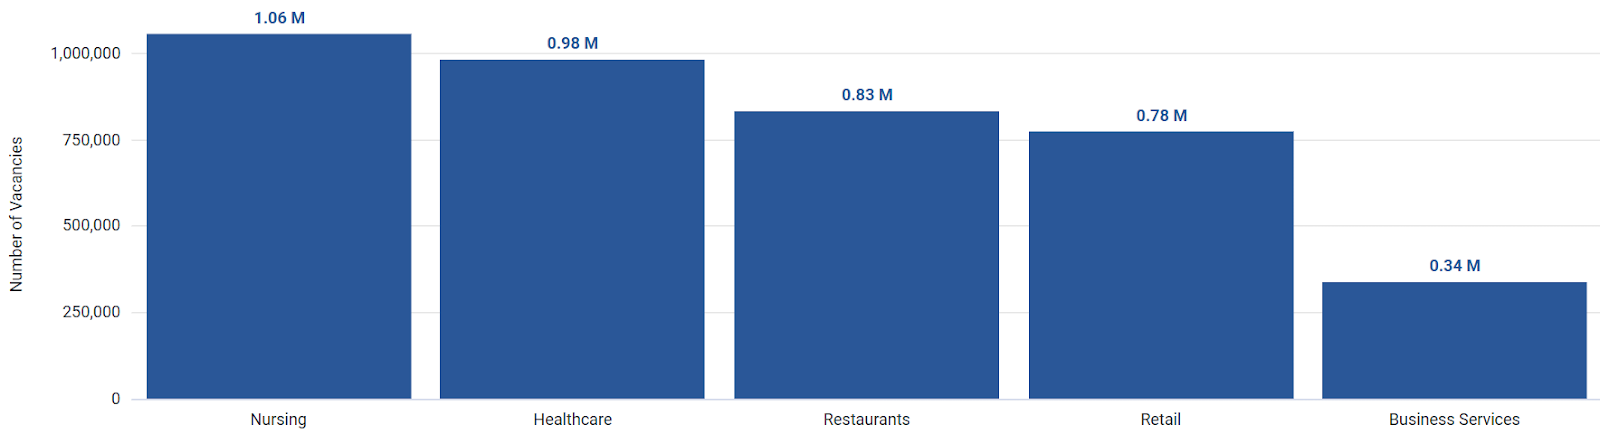
Figure 3: Top 5 job categories by number of vacancies in January 2026
The National View Hides Local Variation
Florida offers a useful case study in divergence.
Figure 4, which tracks Florida’s monthly vacancy trend, shows a rebound that is slightly stronger than the national average. Florida reached nearly 477,000 open roles in January, up 8.1% MoM and 0.7% YoY. Unlike the national total, Florida has edged back into positive annual territory.
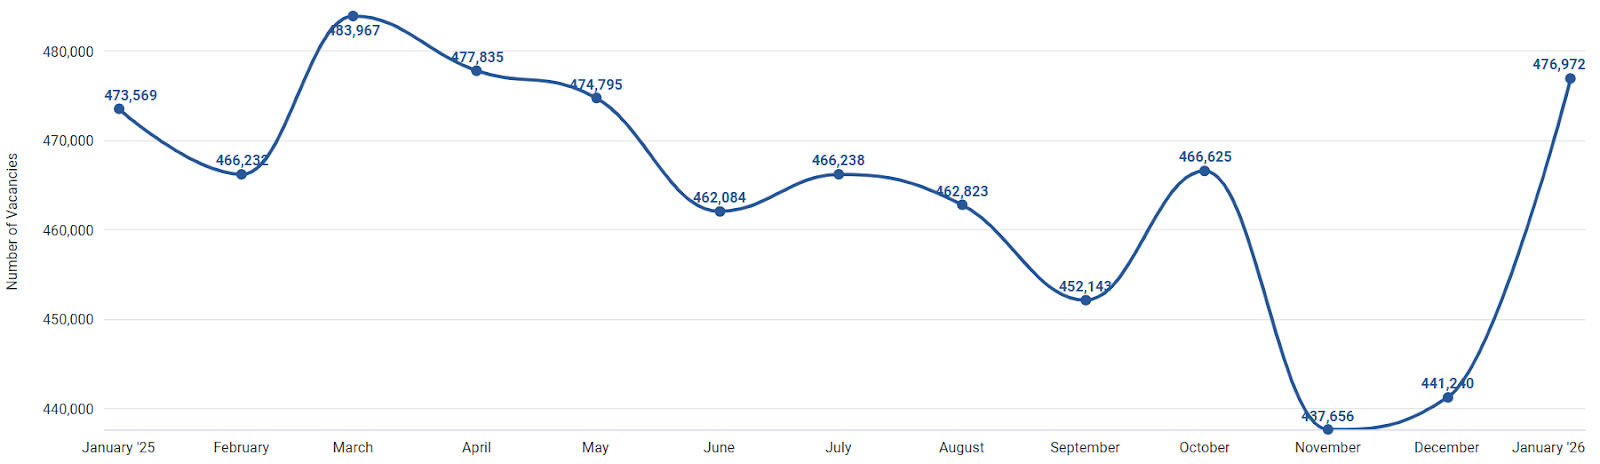
Figure 4: Florida monthly vacancy trend, last 12 months
However, Figure 5 complicates the story. The metro breakdown shows Naples–Marco Island posting an 18.6% YoY increase, while Cape Coral–Fort Myers declined by 11.6%. The Miami market, which includes Fort Lauderdale and West Palm Beach, remains the largest by total volume, but it is not the fastest growing.
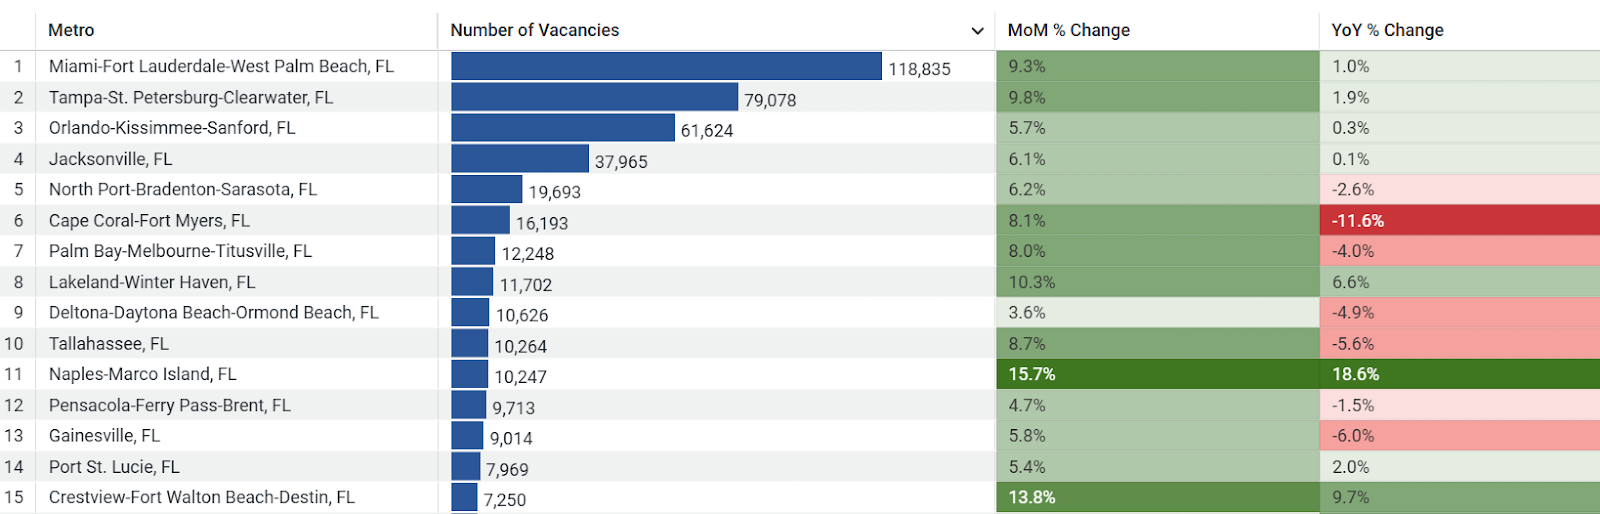
Figure 5: Top 15 metro areas in Florida by number of job openings, with MoM and YoY changes
The visual contrast across metros makes one point clear. Even within a state that appears stable or slightly improving at the aggregate level, local labor markets are moving in different directions. Growth is uneven. Reallocation is happening beneath the surface.
For talent leaders, this matters. A statewide improvement does not guarantee easier recruiting conditions in every city.
Wages Are Moving, But Not Rapidly
Compensation trends reinforce the theme of moderation.
The median advertised full-time salary nationwide stands at $62,400, unchanged from December but up 4.0% YoY. Part-time hourly pay sits at $18.15, up only 0.2% over the past year. Pay levels are edging higher, but not at a pace that suggests tightening labor conditions. There is no visual sign of acceleration.
Figure 6, which breaks down median annual salaries across Florida’s top ten job categories by vacancy volume, shows clear differences by function. Healthcare and business services roles sit meaningfully higher than restaurants and retail. The spread across categories highlights structural pay differences tied to skill requirements, not sudden wage inflation.
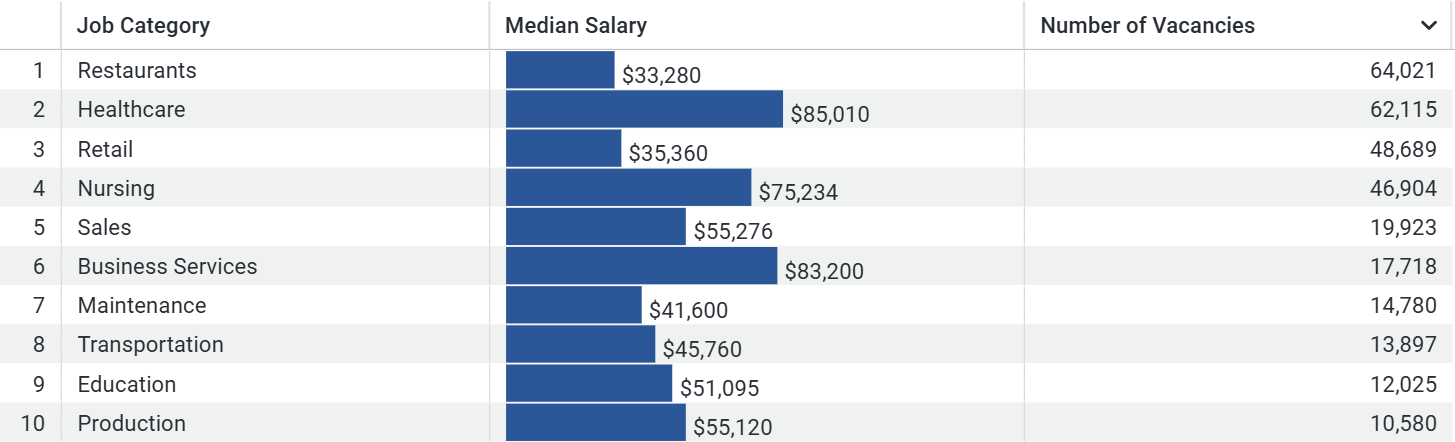
Figure 6: Median annual salaries in Florida for the top 10 job categories by number of vacancies
If employers were competing more aggressively for talent, we would expect sharper upward movement in these lines; instead, the data points to contained wage growth.
Transparency Is Becoming Standard
Figure 7 tracks salary transparency across the U.S. over the last twelve months. The line trends steadily upward. More than half of all postings now include salary information, reaching 53.4% in January. That is 4.4 percentage points higher than a year ago. The increase has been gradual rather than abrupt, which suggests normalization rather than a one-time compliance spike.
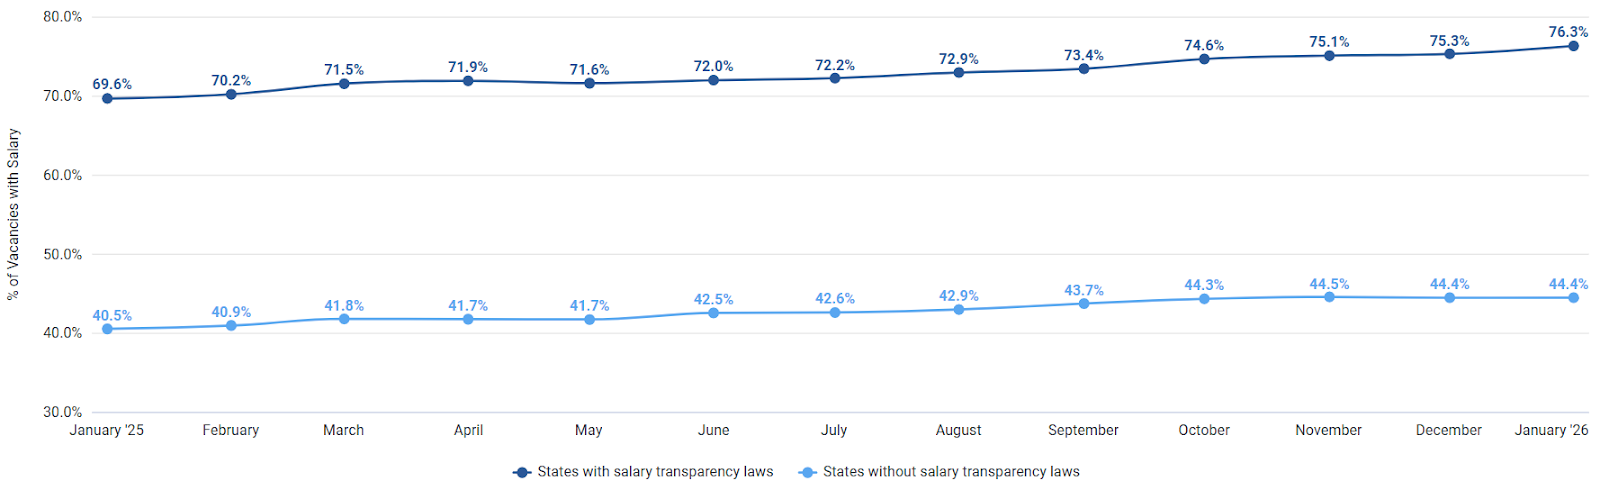
Figure 7: Salary transparency in the U.S., last 12 months
Figure 8 shows the percentage of job postings within each state that include salary information. In Washington, 82.4% of advertised roles disclose pay. Colorado, Hawaii, New York, and California follow closely.
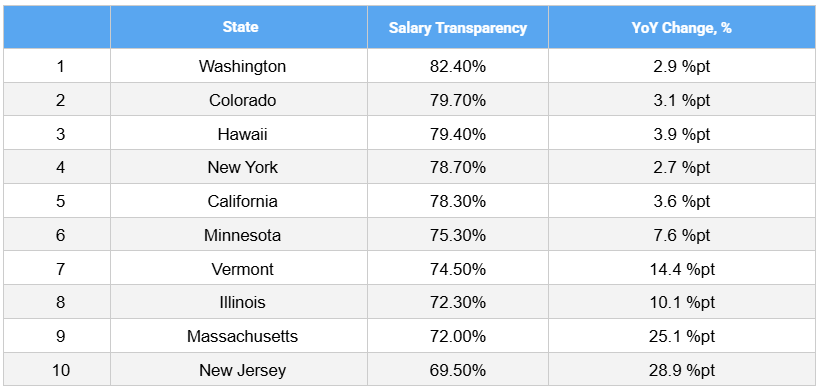
Figure 8: Top 10 states with the highest percentage of vacancies that include salary information.
What is equally notable is the YoY change column. States such as Massachusetts and New Jersey show particularly sharp increases, up 25.1 and 28.9 percentage points, respectively. Vermont and Illinois also recorded double-digit gains. This shows that transparency is not confined to early adopter states. It is accelerating in others that may have introduced newer disclosure requirements or strengthened enforcement.
Visually, the ranking chart clearly shows the regulatory effect. States with established pay disclosure laws dominate the top of the list. The gap between these states and those without such mandates remains substantial. Transparency levels above 75% are clustered in jurisdictions where disclosure is required, while non-mandated states continue to trail behind the national average.
This pattern is not cyclical. It does not fluctuate with vacancy volumes. It reflects the structural alignment among regulation, employer practices, and candidate expectations.
Even in a more cautious hiring environment, visibility continues to expand.
What Would a Real Shift Look Like?
Stabilization can be difficult to interpret because it lacks the drama of expansion or decline. It is worth asking what constitutes a more decisive signal.
A sustained move into positive YoY growth for total vacancies would suggest renewed expansion. A clear acceleration in advertised wage growth could point to tightening labor conditions. Broader geographic alignment, where most states and metros move in the same direction, would indicate stronger synchronization.
As of January 2026, we do not see those patterns. Instead, we see modest MoM recovery, continued YoY softness, stable pay growth, expanding transparency, and widening regional divergence.
What the Early Signals Do Not Tell Us
The January data does not point to a new hiring boom. It does not suggest wage-driven inflation. It does not show a broad revival of remote work. And it does not indicate collapse.
What it shows is steadier ground. Employers are advertising roles. Compensation is stable. Transparency is increasing. Growth varies by region and sector.
For investors, talent leaders, and policymakers, the implication is similar. The labor market is adjusting rather than accelerating. Decisions appear more deliberate. Hiring intent is present, but it is measured.
The coming months will reveal whether this balance holds or shifts. For now, early 2026 looks less like a turning point and more like a continuation of gradual decline, moderated by seasonal resets and concentrated demand in essential sectors.
Data Methodology
The findings in this analysis are based on Aspen Tech Labs’ JobMarketPulse platform, which monitors hiring activity from more than 350,000 direct employer career sites worldwide. This dataset captures a substantial share of live postings and provides near-real-time insight into employer demand. All figures reflect information published directly by employers, including salary ranges where available. All data comes from posted job requirements; salary figures should be interpreted as indicators of market trends rather than confirmed offer amounts. Changes reflect real shifts in hiring activity rather than database expansion or methodological updates.