

Special Release: Aspen’s Real-Time Labor Market Update Amid Delayed BLS Reporting
Aspen Tech Labs tracks millions of live job postings every day, giving us one of the earliest reads on real-time hiring activity across the U.S. labor market. Because we collect postings directly from over 250,000 U.S. corporate career sites (not job boards or aggregators), we often see shifts in employer demand weeks before they appear in government data. As we enter the last six weeks of the year, our data shows a slightly softening hiring market, making timely, high-frequency indicators especially valuable while federal reporting remains disrupted.
Yesterday, the federal government finally released the delayed September BLS Employment Situation Report, more than six weeks after the original publication date. While the data provides an important snapshot of labor-market conditions, its timing and subsequent revisions underscore a long-standing challenge with relying solely on government labor statistics: even when the numbers are released, they are often already outdated.
What Was Released Yesterday (or Recently)
1. September Employment Situation (Payrolls)
- Nonfarm payrolls increased by 119,000 in September (Figure 1)
- Unemployment rate: 4.4%
- Hiring gains were led by health care, food services, and social assistance
- Losses were concentrated in transportation & warehousing and federal government
- The release arrived more than 6 weeks late due to the federal shutdown.
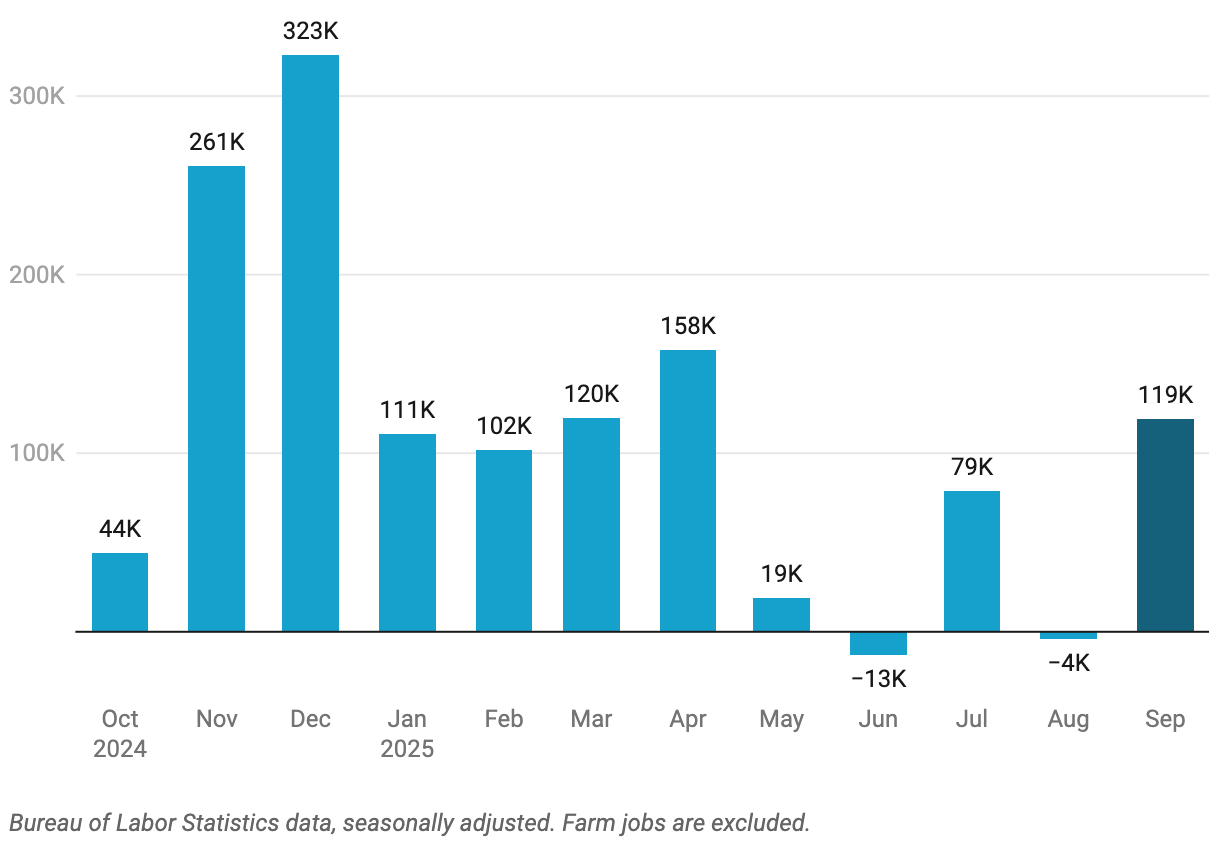 Figure 1: Monthly Change in Nonfarm Payrolls
As is typical, the BLS also revised prior months’ payroll figures. Both July and August were adjusted downward, continuing a pattern seen throughout 2024-2025 (numbers in the chart above are revised numbers). These revisions are a routine part of the process – payroll data is almost always updated, sometimes materially, for several months after the initial release as additional survey responses are collected.
- JOLTS (Job Openings and Labor Turnover Survey)
- The most recent available JOLTS data covers August, released on September 30.
- According to BLS, August job openings were 7.227 million, little changed from July.
- September JOLTS was canceled due to the shutdown and will be merged with October’s data when released.
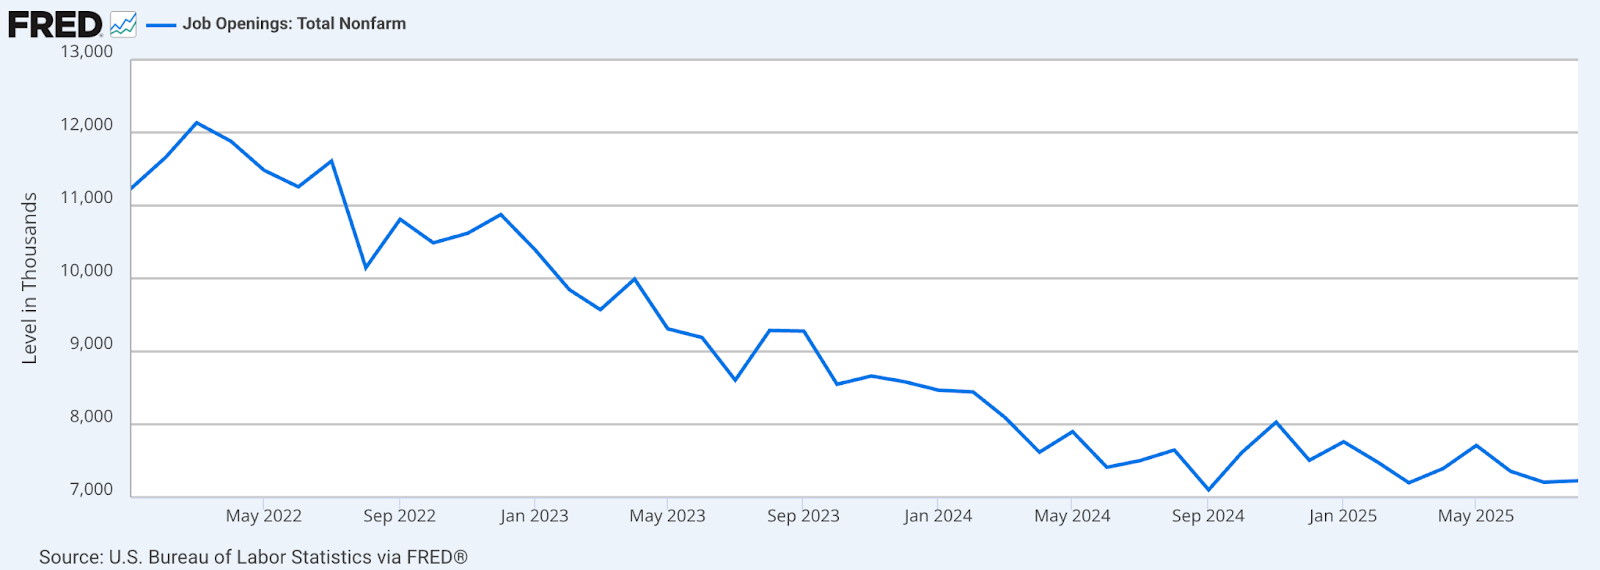
Figure 2: JOLTS Job Openings (Total Nonfarm)
Because of the extended shutdown, several key data series are simply missing. BLS will not publish a normal October Employment Situation Report, and the household survey for October was never collected and those figures cannot be recreated retroactively. State-level unemployment updates for September and October remain delayed or unissued, and JOLTS will also have a multi-month gap before regular reporting resumes.
Aspen Tech Labs Mid-November Update
With several federal datasets delayed, incomplete, or canceled outright, it’s worth turning to the real-time indicators that can fill these gaps. Aspen Tech Labs monitors job posting activity directly from more than 250,000 U.S. corporate career sites, offering immediate visibility into hiring demand that does not rely on survey responses or long reporting lags.
While not comprehensive of every job opening (not all roles are posted online) our dataset captures virtually all major employers, including the Fortune 1000 and Russell 3000. In total, we estimate that our coverage reflects roughly 80% of the market, providing a far more immediate read on future hiring activity than the lagged and survey-based JOLTS series.
Against this backdrop, Aspen’s daily job postings show a steady downward trend beginning in mid-summer, followed by a slight October rebound. Comparing year over year, active vacancies are down roughly 5.8% from November 1, 2024 to November 1, 2025, indicating a moderate but clear cooling in employer demand heading into the end of the year (Figure 3).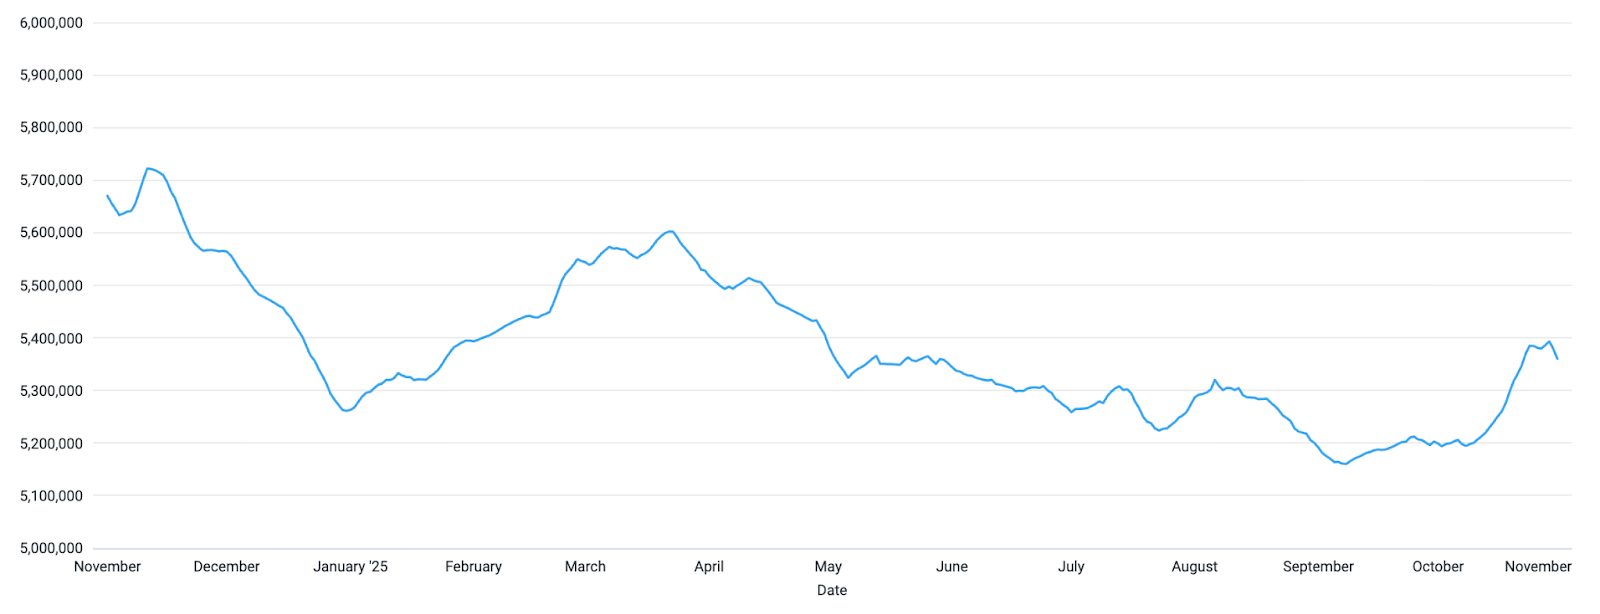
Figure 3: Daily U.S. Job Postings from Aspen’s JobsIndex
Monthly active job postings – defined as the total number of open roles that were live on employer career sites at any point during the month – remain broadly elevated compared with late 2023 but have softened relative to their mid-2025 peaks. This gradual decline reflects employers becoming more selective in their hiring while still maintaining relatively high staffing needs, suggesting a moderating, but not collapsing, labor market (Figure 4).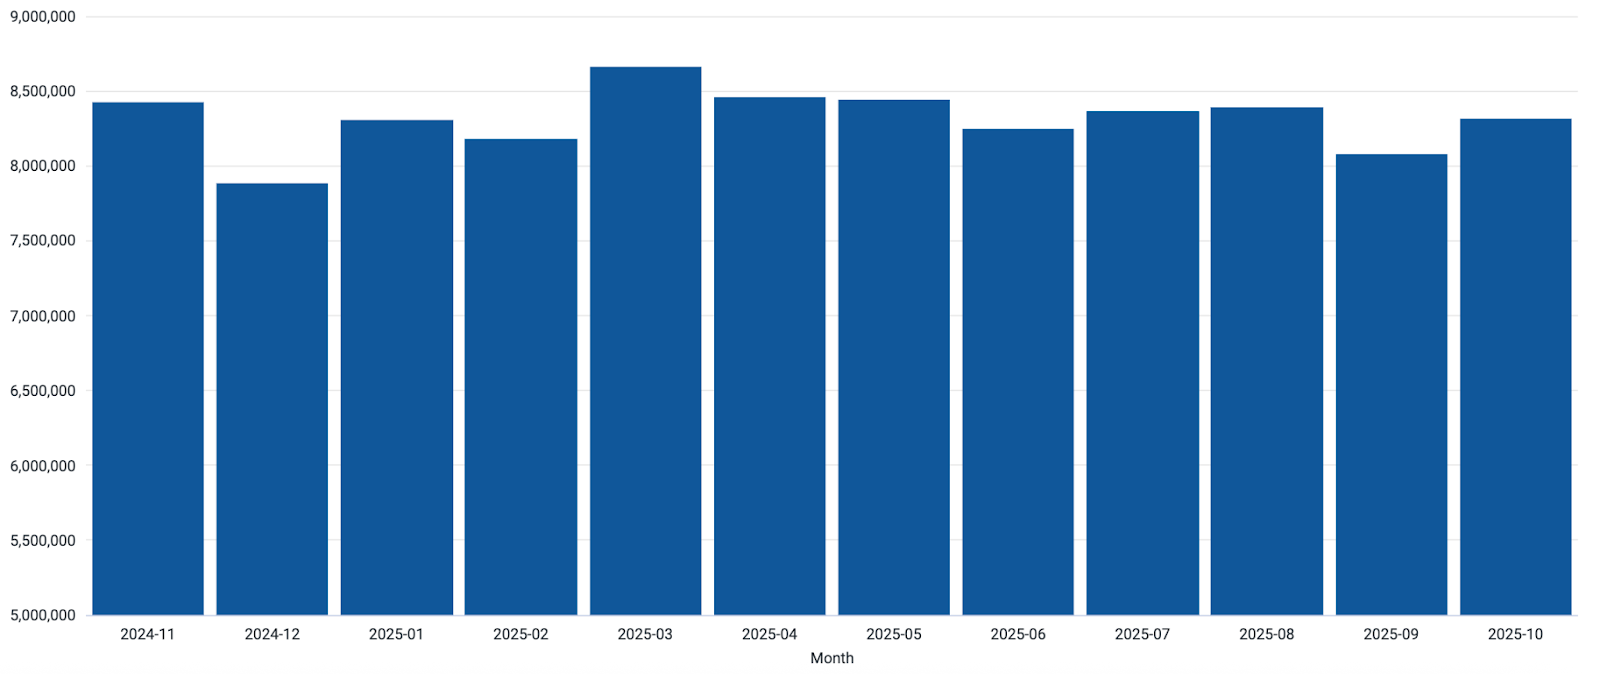
Figure 4: Total Monthly Active U.S. Job Postings from Aspen’s JobsIndex
This moderate decline in postings aligns directionally with what we see in JOLTS, where August job openings were little changed but remain well below their 2022-2023 highs. However, compared with the September payroll data, which still showed a gain of 119,000 jobs, our posting data suggests that employer demand is cooling earlier and more gradually than payrolls alone would imply. Payrolls measure hiring that has already occurred, while postings capture employer intent.
Taken together, the year-over-year drop in postings, the flat JOLTS openings, and the modest payroll gains all point to a labor market that is loosening slowly, not collapsing – something only visible by combining real-time vacancy data with delayed government surveys.
Our S&P 500 Vacancy Trend tracks the number of open job postings published daily on the corporate career sites of S&P 500 companies. Posted vacancies have gradually declined throughout 2025 (-1.8%), easing from spring highs to the mid-90s range by late fall when indexed to 100 (Figure 5).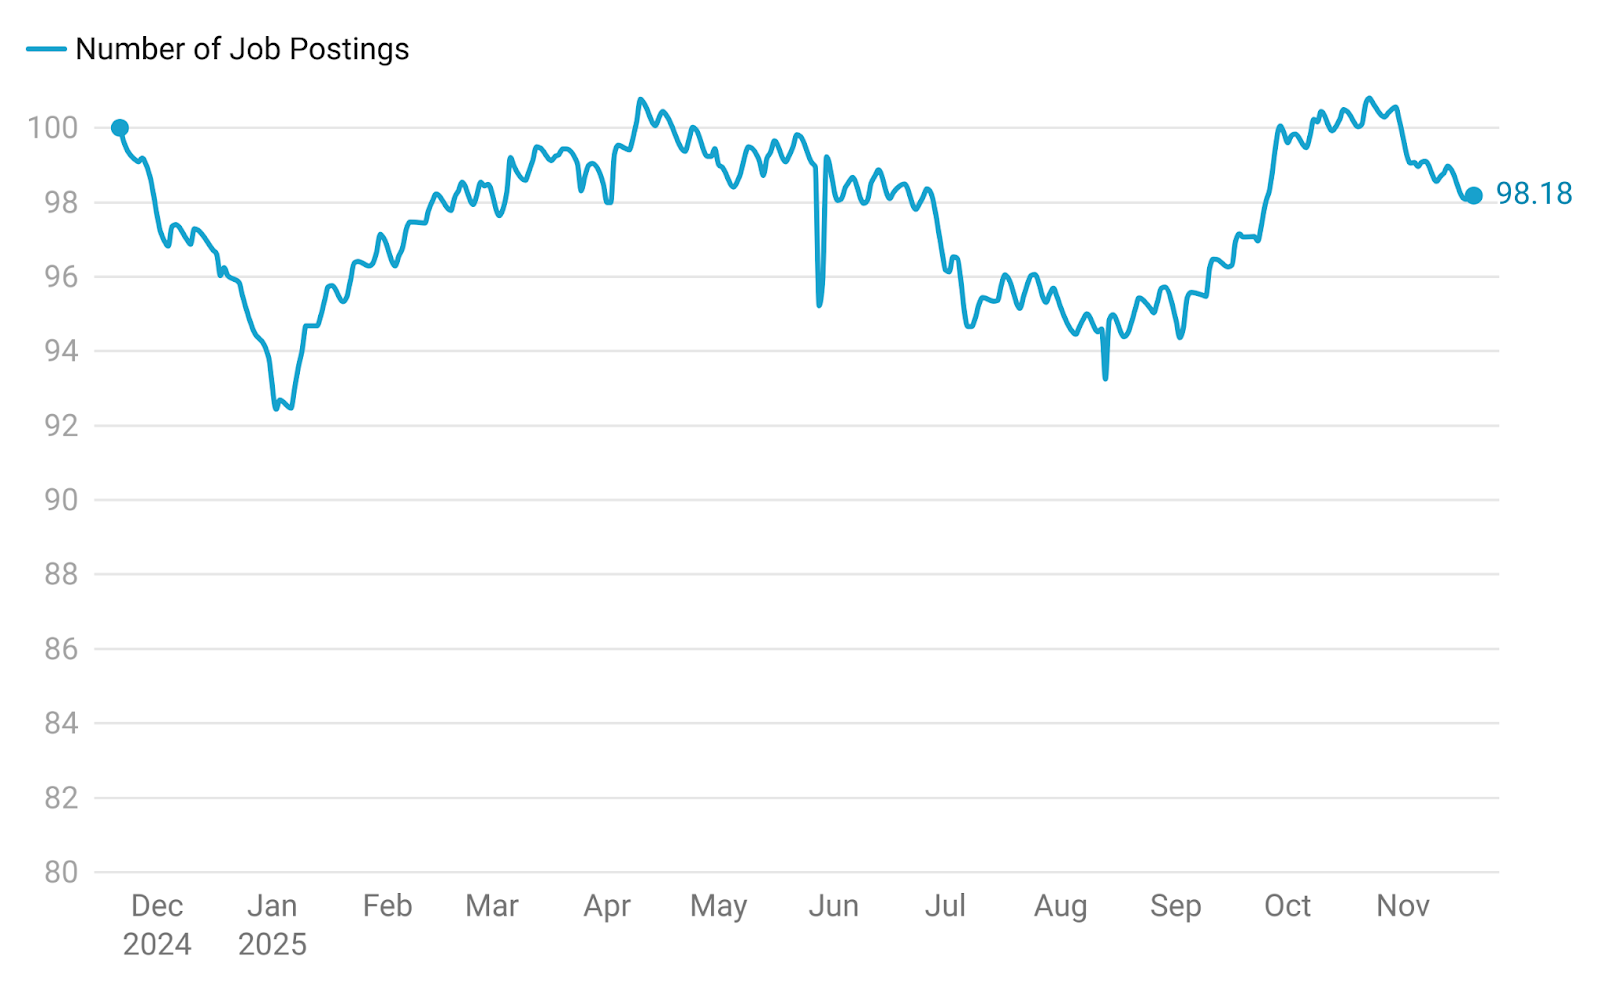
Figure 5: S&P 500 Companies Vacancy Trend (Indexed to 100)
Even with this softening, postings remain only modestly below year-ago levels (-1.8% for S&P 500 Index and -5.8% for the U.S. Index). That’s notable given continued headlines about layoffs, restructuring, and AI-related role consolidation. Taken together, these trends point to a cooling of posted roles rather than an abrupt pullback, offering a timely view into how employers are managing hiring plans over the course of the year.
Looking ahead, Aspen Tech Labs predicts a decline in vacancies through year-end. In each of the past three years, active vacancies have fallen sharply in November and December as companies let job postings expire, finalize budgeting, and pause non-essential hiring ahead of the holidays.
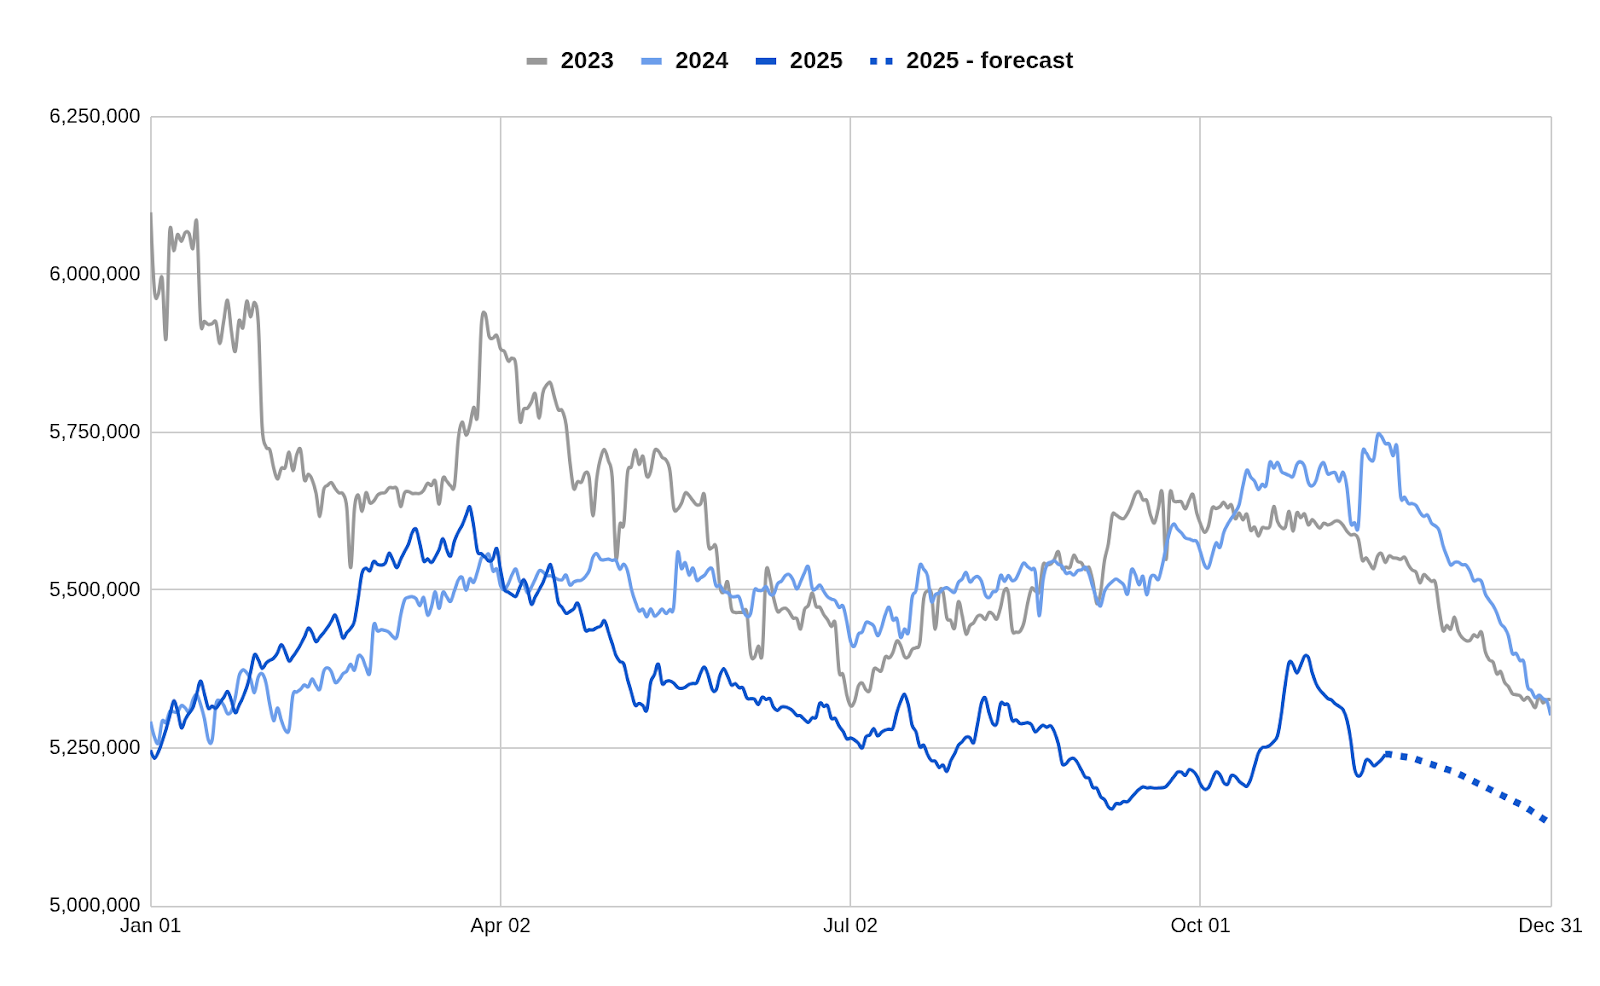
Figure 6: Vacancy Trends Through Year-End: 2023-2025
The 2025 trend is already tracking closely to prior years, with postings drifting downward from their early-fall levels and beginning to follow the familiar seasonal curve. Based on these historical patterns, we expect vacancies to continue easing through December, followed by a strong rebound at the start of the new year as employers reopen positions, post new budgets, and resume paused hiring.
Missed our Q3 U.S. Jobs Report? Grab the PDF version here.
Need custom labor market reports? Whether you’re analyzing wage growth in Boston or tracking hiring surges in tech across Austin, our JobMarketPulse Intelligence Suite delivers powerful, customizable data to help you identify companies experiencing growth or decline, uncover hiring surges, track wage trends, and analyze emerging patterns across sectors. Contact us to get a demo.